
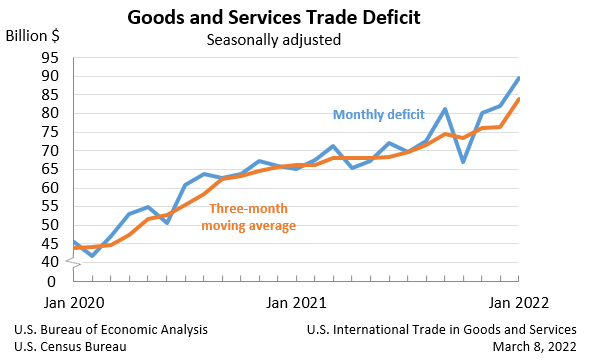
The U.S. Census Bureau and the U.S. Bureau of Economic Analysis announced today that the goods and services deficit was $89.7 billion in January, up $7.7 billion from $82.0 billion in December, revised.
U.S. International Trade in Goods and Services Deficit
| Deficit: | $89.7 Billion | +9.4%° |
| Exports: | $224.4 Billion | -1.7%° |
| Imports: | $314.1 Billion | +1.2%° |
| Next release: Tuesday, April 5, 2022 | ||
(°) Statistical significance is not applicable or not measurable. Data adjusted for seasonality but not price changes
Source: U.S. Census Bureau, U.S. Bureau of Economic Analysis; U.S. International Trade in Goods and Services, March 8, 2022
Exports, Imports, and Balance (exhibit 1)
January exports were $224.4 billion, $3.9 billion less than December exports. January imports were $314.1 billion, $3.8 billion more than December imports.
The January increase in the goods and services deficit reflected an increase in the goods deficit of $7.1 billion to $108.9 billion and a decrease in the services surplus of $0.6 billion to $19.2 billion.
Year-over-year, the goods and services deficit increased $24.6 billion, or 37.7 percent, from January 2021. Exports increased $29.9 billion or 15.4 percent. Imports increased $54.4 billion or 21.0 percent.
COVID-19 Impact on International Trade in Goods and Services
The global pandemic and the economic recovery continued to impact international trade in January 2022. The full economic effects of the pandemic cannot be quantified in the statistics because the impacts are generally embedded in source data and cannot be separately identified.
Three-Month Moving Averages (exhibit 2)
The average goods and services deficit increased $7.6 billion to $83.9 billion for the three months ending in January.
- Average exports decreased $0.1 billion to $225.9 billion in January.
- Average imports increased $7.5 billion to $309.8 billion in January.
Year-over-year, the average goods and services deficit increased $17.8 billion from the three months ending in January 2021.
- Average exports increased $35.7 billion from January 2021.
- Average imports increased $53.6 billion from January 2021.
Exports (exhibits 3, 6, and 7)
Exports of goods decreased $2.3 billion to $155.9 billion in January.
Exports of goods on a Census basis decreased $2.3 billion.
- Consumer goods decreased $3.0 billion.
- Pharmaceutical preparations decreased $3.2 billion.
- Capital goods increased $1.1 billion.
- Civilian aircraft increased $0.4 billion.
- Telecommunications equipment increased $0.2 billion.
Net balance of payments adjustments decreased less than $0.1 billion.
Exports of services decreased $1.6 billion to $68.5 billion in January.
- Travel decreased $1.8 billion.
- Transport decreased $0.5 billion.
- Other business services increased $0.3 billion.
- Financial services increased $0.2 billion.
Imports (exhibits 4, 6, and 8)
Imports of goods increased $4.8 billion to $264.8 billion in January.
Imports of goods on a Census basis increased $4.6 billion.
- Automotive vehicles, parts, and engines increased $1.6 billion.
- Passenger cars increased $0.8 billion.
- Other automotive parts and accessories increased $0.5 billion.
- Industrial supplies and materials increased $1.5 billion.
- Crude oil increased $0.9 billion.
- Natural gas increased $0.6 billion.
- Copper increased $0.6 billion.
- Foods, feeds, and beverages increased $1.4 billion.
- Other foods increased $0.5 billion.
- Meat products increased $0.2 billion.
- Capital goods increased $1.1 billion.
- Telecommunications equipment increased $0.3 billion.
- Other industrial machinery increased $0.3 billion.
- Semiconductors decreased $0.6 billion.
- Other goods decreased $1.6 billion.
Net balance of payments adjustments increased $0.2 billion.
Imports of services decreased $1.0 billion to $49.3 billion in January.
- Transport decreased $0.8 billion.
- Travel decreased $0.5 billion.
- Other business services increased $0.1 billion.
Real Goods in 2012 Dollars – Census Basis (exhibit 11)
The real goods deficit increased $6.4 billion to $118.1 billion in January.
- Real exports of goods decreased $6.0 billion to $147.2 billion.
- Real imports of goods increased $0.4 billion to $265.3 billion.
Revisions
Exports and imports of goods and services were revised for July through December 2021 to incorporate more comprehensive and updated quarterly and monthly data. In addition to these revisions, seasonally adjusted data for all months of 2021 were revised so that the totals of the seasonally adjusted months equal the annual totals.
Revisions to December exports
- Exports of goods were revised down $0.1 billion.
- Exports of services were revised up $0.3 billion.
Revisions to December imports
- Imports of goods were revised up $0.3 billion.
- Imports of services were revised up $1.2 billion.
Goods by Selected Countries and Areas: Monthly – Census Basis (exhibit 19)
The January figures show surpluses, in billions of dollars, with South and Central America ($4.4), Hong Kong ($2.0), Singapore ($1.3), Brazil ($1.1), and United Kingdom ($1.0). Deficits were recorded, in billions of dollars, with China ($33.3), European Union ($18.0), Mexico ($12.5), Japan ($7.1), Canada ($6.8), Germany ($5.4), Taiwan ($3.9), Italy ($3.2), South Korea ($3.0), India ($2.4), Saudi Arabia ($0.8), and France ($0.8).
- The deficit with Canada increased $2.6 billion to $6.8 billion in January. Exports decreased $1.2 billion to $27.7 billion and imports increased $1.4 billion to $34.5 billion.
- The deficit with Japan increased $2.1 billion to $7.1 billion in January. Exports increased $0.1 billion to $6.2 billion and imports increased $2.2 billion to $13.4 billion.
- The deficit with India decreased $1.5 billion to $2.4 billion in January. Exports increased $0.6 billion to $4.3 billion and imports decreased $0.9 billion to $6.7 billion.
Goods and Services by Selected Countries and Areas: Quarterly – Balance of Payments Basis
Statistics on trade in goods and services by country and area are only available quarterly, with a one-month lag. With this release, fourth-quarter figures are now available.
The fourth-quarter figures show surpluses, in billions of dollars, with South and Central America ($22.1), Hong Kong ($6.7), Brazil ($6.4), Singapore ($5.1), United Kingdom ($5.0), and Saudi Arabia ($0.7). Deficits were recorded, in billions of dollars, with China ($87.9), European Union ($39.4), Mexico ($33.5), Germany ($18.4), India ($13.8), Taiwan ($11.9), Japan ($11.4), Italy ($10.5), Canada ($8.5), South Korea ($6.7), and France ($4.6).
- The deficit with China increased $8.4 billion to $87.9 billion in the fourth quarter. Exports increased $2.8 billion to $48.0 billion and imports increased $11.2 billion to $136.0 billion.
- The deficit with Mexico increased $8.3 billion to $33.5 billion in the fourth quarter. Exports increased $1.8 billion to $79.5 billion and imports increased $10.1 billion to $113.0 billion.
- The deficit with Japan decreased $4.5 billion to $11.4 billion in the fourth quarter. Exports increased $1.6 billion to $28.9 billion and imports decreased $2.8 billion to $40.4 billion.
Full article: BEA