March 2022 / United States

March 31 2022

IRS Releases 2021 Report on Advance Transfer Pricing Agreements

The US Internal Revenue Service (IRS) has released its annual report for 2021 on advance pricing agreements (APAs) and the advance pricing and mutual agreement (APMA) program for transfer pricing transactions.

The IRS issued the report in the form of IRS Announcement 2022-7, dated 22 March 2022.

Part I of the report summarizes the structure, composition, and operation of the APMA program. Part I of the report notes that, on 31 August 2015, the IRS issued revised procedures for requesting competent authority assistance and revised procedures for APA applications.

Part II of the report presents the statistical data related to the APMA program results, both in table and graphical format. According to Part II of the report, 124 APAs were executed in 2021, comprised of 25 unilateral APAs, 98 bilateral APAs and 1 multilateral APA. In addition, 78 APAs were renewed in 2021, consisting of 19 unilateral APAs, 59 bilateral APAs and 0 multilateral APA. There were 145 new APA applications filed in 2021, consisting of 16 unilateral applications, 121 bilateral applications and 8 multilateral applications. The number of APA requests pending at the end of 2021 was 185, including both new requests and requests for renewals. Part II also includes the statistical results of the APMA program by reference to countries and industry sectors.

Part III of the report provides general descriptions of various elements of the APAs executed in 2021, including types of tested parties, covered transactions, functions, and risks, as well as transfer pricing methods used, critical assumptions, and the amount of time taken to complete APA requests during 2021.

With regard to the length of time needed to complete an APA request during 2021, Part III of the report indicates an average time of 39.2 months and a median time of 35.1 months taking into account both new requests and requests for renewal. Timing data was also provided separately for unilateral and bilateral requests.

The report includes the texts of two Model APAs as Appendix 1 and Appendix 2.

The report is set to appear in the Internal Revenue Bulletin (IRB) 2022-15, dated 11 April 2022.

Note: The APMA program, as the successor to the APA program, continues the procedure whereby taxpayers and the IRS can enter into a binding agreement under which the IRS accepts the transfer pricing methodology (TPM) used by the taxpayer, and agrees not to seek a transfer pricing adjustment under section 482 of the US Internal Revenue Code (IRC) if the taxpayer files its tax returns consistent with the agreed TPM. The APMA program is intended to resolve potential transfer pricing disputes between taxpayers and the IRS prior to the tax return auditing process.

March 9 2022

US Congress Finally Strikes Deal on FY 2022 Spending

The US Senate approved the Consolidated Appropriations Act, 2022 (HR 2471), a USD 1.5 trillion spending bill, in an 8 March 2022 vote, and the US House of Representatives is expected to do the same on 9 March 2022.

The 2,741-page measure provides USD 782 billion for defense spending and USD 730 billion for non-defense discretionary spending. Included in those figures is USD 13.6 billion for emergency Ukraine-related defense spending, as well as USD 4 billion to the US State Department to provide assistance to refugees, economic assistance and foreign military assistance and USD 2.8 billion to bolster the US Agency for International Development's (USAID's) immediate humanitarian disaster relief efforts.

The bill's sweeping provisions cover a broad variety of US policies, including language designed to ease the transition of contracts and loans away from the LIBOR benchmark. Its passage comes alongside a shift in focus away from US President Joe Biden's larger economic agenda, which would increase taxes in order to fund initiatives providing healthcare and childcare and combatting climate change.

March 8 2022

US Tax Court Uses Multifactor Approach in Determining Deductible Reasonable Compensation

The US Tax Court has ruled that the US Internal Revenue Service's (IRS's) disallowance of deductions for excess compensation was justifiable. The Tax Court, however, granted the taxpayer compensation deductions greater than the IRS had permitted.

The Tax Court stated that, while corporations may deduct reasonable allowances for salaries or other compensation, the determination of what constitutes reasonableness is a question to be determined from all the facts and circumstances of each particular case (see Martens v. Commissioner, 934 F.2d 319).

The Tax Court also cited US Treasury Regulations section 1.162-7(b)(3), which provides that reasonable and true compensation is an amount "as would ordinarily be paid for like services by like enterprises under like circumstances."

In determining an appropriate compensation, the Tax Court used the multifactor approach (MFA) that the US Court of Appeals for the Fourth Circuit, to which an appeal of the present case would lie, utilizes.

The MFA requires an analysis of the following factors:

  • the employee's qualifications;
  • the nature, extent and scope of the employee's work;
  • the size and complexities of the business;
  • a comparison of salaries paid with gross income and net income;
  • the prevailing general economic conditions;
  • comparison of salaries with distributions to stockholders;
  • the prevailing rates of compensation for comparable positions in comparable concerns; and
  • the salary policy of the taxpayer as to all employees.

In rendering its opinion, the Tax Court pointed out that no single factor was decisive but instead weighed the totality of the facts and circumstances. In this particular case, the most dominant factors were:

  • the comparable pay by comparable concerns;
  • the distribution history;
  • the process used in setting the compensation in the years at issue; and
  • the involvement by the employee at issue (i.e. the taxpayer's chief executive officer (CEO) and shareholder) in the taxpayer's business.

Furthermore, the Tax Court also gave greater weight to the testimony of the IRS' valuation expert than those of the taxpayer who utilized the independent investor test.

Note: The independent investor test is another standard that certain courts utilized. This test considers what an inactive, independent investor would be willing to compensate the employee.

March 31 2022

U.S. International Trade in Goods and Services, January 2022

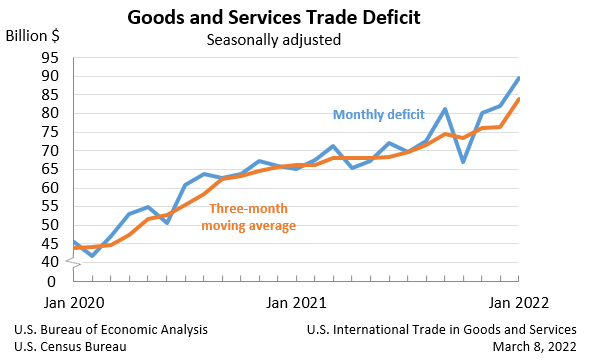
The U.S. Census Bureau and the U.S. Bureau of Economic Analysis announced today that the goods and services deficit was $89.7 billion in January, up $7.7 billion from $82.0 billion in December, revised.

  U.S. International Trade in Goods and Services Deficit
Deficit: $89.7 Billion +9.4%°
Exports: $224.4 Billion -1.7%°
Imports: $314.1 Billion +1.2%°
Next release: Tuesday, April 5, 2022
(°) Statistical significance is not applicable or not measurable. Data adjusted for seasonality but not price changes Source: U.S. Census Bureau, U.S. Bureau of Economic Analysis; U.S. International Trade in Goods and Services, March 8, 2022  
Goods and Services Trade Deficit, Seasonally adjusted

Exports, Imports, and Balance (exhibit 1)

January exports were $224.4 billion, $3.9 billion less than December exports. January imports were $314.1 billion, $3.8 billion more than December imports.

The January increase in the goods and services deficit reflected an increase in the goods deficit of $7.1 billion to $108.9 billion and a decrease in the services surplus of $0.6 billion to $19.2 billion.

Year-over-year, the goods and services deficit increased $24.6 billion, or 37.7 percent, from January 2021. Exports increased $29.9 billion or 15.4 percent. Imports increased $54.4 billion or 21.0 percent.

COVID-19 Impact on International Trade in Goods and Services

The global pandemic and the economic recovery continued to impact international trade in January 2022. The full economic effects of the pandemic cannot be quantified in the statistics because the impacts are generally embedded in source data and cannot be separately identified.

Three-Month Moving Averages (exhibit 2)

The average goods and services deficit increased $7.6 billion to $83.9 billion for the three months ending in January.

  • Average exports decreased $0.1 billion to $225.9 billion in January.
  • Average imports increased $7.5 billion to $309.8 billion in January.

Year-over-year, the average goods and services deficit increased $17.8 billion from the three months ending in January 2021.

  • Average exports increased $35.7 billion from January 2021.
  • Average imports increased $53.6 billion from January 2021.

Exports (exhibits 3, 6, and 7)

Exports of goods decreased $2.3 billion to $155.9 billion in January.

Exports of goods on a Census basis decreased $2.3 billion.

  • Consumer goods decreased $3.0 billion.
    • Pharmaceutical preparations decreased $3.2 billion.
  • Capital goods increased $1.1 billion.
    • Civilian aircraft increased $0.4 billion.
    • Telecommunications equipment increased $0.2 billion.

Net balance of payments adjustments decreased less than $0.1 billion.

Exports of services decreased $1.6 billion to $68.5 billion in January.

  • Travel decreased $1.8 billion.
  • Transport decreased $0.5 billion.
  • Other business services increased $0.3 billion.
  • Financial services increased $0.2 billion.

Imports (exhibits 4, 6, and 8)

Imports of goods increased $4.8 billion to $264.8 billion in January.

Imports of goods on a Census basis increased $4.6 billion.

  • Automotive vehicles, parts, and engines increased $1.6 billion.
    • Passenger cars increased $0.8 billion.
    • Other automotive parts and accessories increased $0.5 billion.
  • Industrial supplies and materials increased $1.5 billion.
    • Crude oil increased $0.9 billion.
    • Natural gas increased $0.6 billion.
    • Copper increased $0.6 billion.
  • Foods, feeds, and beverages increased $1.4 billion.
    • Other foods increased $0.5 billion.
    • Meat products increased $0.2 billion.
  • Capital goods increased $1.1 billion.
    • Telecommunications equipment increased $0.3 billion.
    • Other industrial machinery increased $0.3 billion.
    • Semiconductors decreased $0.6 billion.
  • Other goods decreased $1.6 billion.

Net balance of payments adjustments increased $0.2 billion.

Imports of services decreased $1.0 billion to $49.3 billion in January.

  • Transport decreased $0.8 billion.
  • Travel decreased $0.5 billion.
  • Other business services increased $0.1 billion.

Real Goods in 2012 Dollars – Census Basis (exhibit 11)

The real goods deficit increased $6.4 billion to $118.1 billion in January.

  • Real exports of goods decreased $6.0 billion to $147.2 billion.
  • Real imports of goods increased $0.4 billion to $265.3 billion.

Revisions

Exports and imports of goods and services were revised for July through December 2021 to incorporate more comprehensive and updated quarterly and monthly data. In addition to these revisions, seasonally adjusted data for all months of 2021 were revised so that the totals of the seasonally adjusted months equal the annual totals.

Revisions to December exports

  • Exports of goods were revised down $0.1 billion.
  • Exports of services were revised up $0.3 billion.

Revisions to December imports

  • Imports of goods were revised up $0.3 billion.
  • Imports of services were revised up $1.2 billion.

Goods by Selected Countries and Areas: Monthly – Census Basis (exhibit 19)

The January figures show surpluses, in billions of dollars, with South and Central America ($4.4), Hong Kong ($2.0), Singapore ($1.3), Brazil ($1.1), and United Kingdom ($1.0). Deficits were recorded, in billions of dollars, with China ($33.3), European Union ($18.0), Mexico ($12.5), Japan ($7.1), Canada ($6.8), Germany ($5.4), Taiwan ($3.9), Italy ($3.2), South Korea ($3.0), India ($2.4), Saudi Arabia ($0.8), and France ($0.8).

  • The deficit with Canada increased $2.6 billion to $6.8 billion in January. Exports decreased $1.2 billion to $27.7 billion and imports increased $1.4 billion to $34.5 billion.
  • The deficit with Japan increased $2.1 billion to $7.1 billion in January. Exports increased $0.1 billion to $6.2 billion and imports increased $2.2 billion to $13.4 billion.
  • The deficit with India decreased $1.5 billion to $2.4 billion in January. Exports increased $0.6 billion to $4.3 billion and imports decreased $0.9 billion to $6.7 billion.

Goods and Services by Selected Countries and Areas: Quarterly – Balance of Payments Basis

Statistics on trade in goods and services by country and area are only available quarterly, with a one-month lag. With this release, fourth-quarter figures are now available.

The fourth-quarter figures show surpluses, in billions of dollars, with South and Central America ($22.1), Hong Kong ($6.7), Brazil ($6.4), Singapore ($5.1), United Kingdom ($5.0), and Saudi Arabia ($0.7). Deficits were recorded, in billions of dollars, with China ($87.9), European Union ($39.4), Mexico ($33.5), Germany ($18.4), India ($13.8), Taiwan ($11.9), Japan ($11.4), Italy ($10.5), Canada ($8.5), South Korea ($6.7), and France ($4.6).

  • The deficit with China increased $8.4 billion to $87.9 billion in the fourth quarter. Exports increased $2.8 billion to $48.0 billion and imports increased $11.2 billion to $136.0 billion.
  • The deficit with Mexico increased $8.3 billion to $33.5 billion in the fourth quarter. Exports increased $1.8 billion to $79.5 billion and imports increased $10.1 billion to $113.0 billion.
  • The deficit with Japan decreased $4.5 billion to $11.4 billion in the fourth quarter. Exports increased $1.6 billion to $28.9 billion and imports decreased $2.8 billion to $40.4 billion.

Full article: BEA